
By Kevin Hunter
August 14, 2025
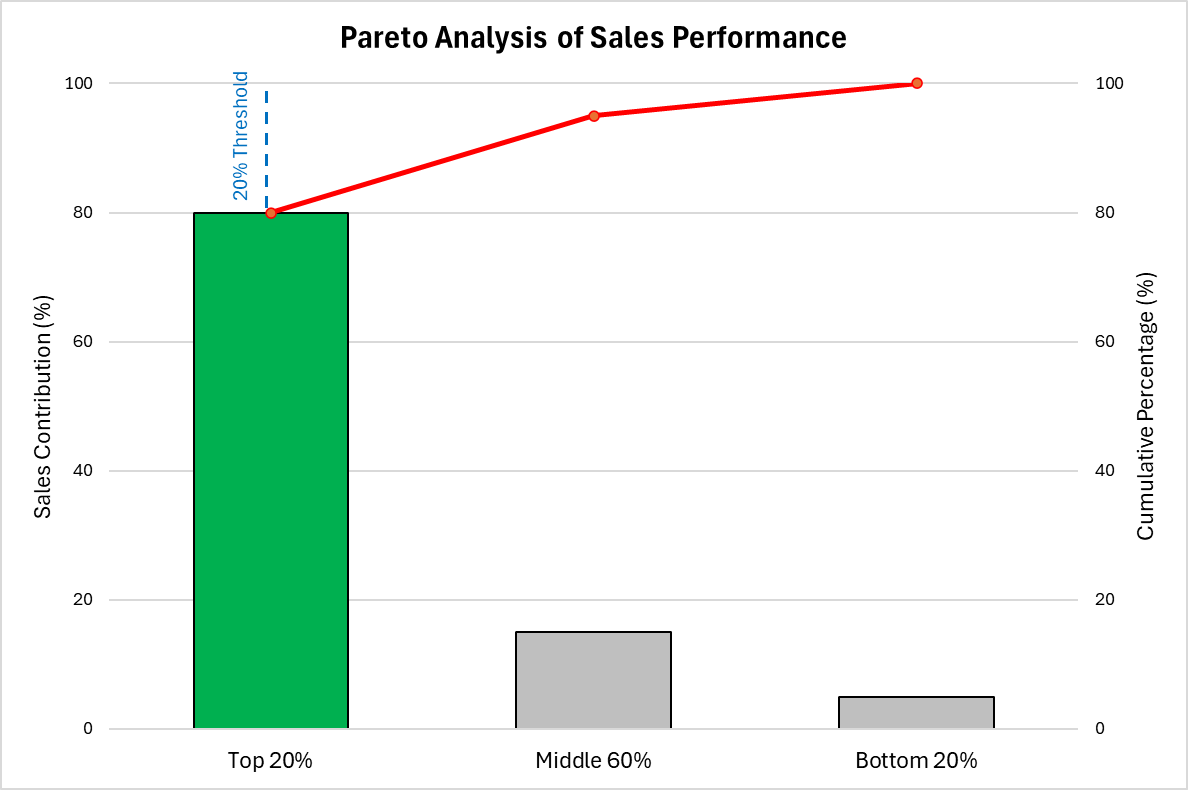
Figure 1: Enhanced Pareto Chart with 20% demarcation and cumulative curve.
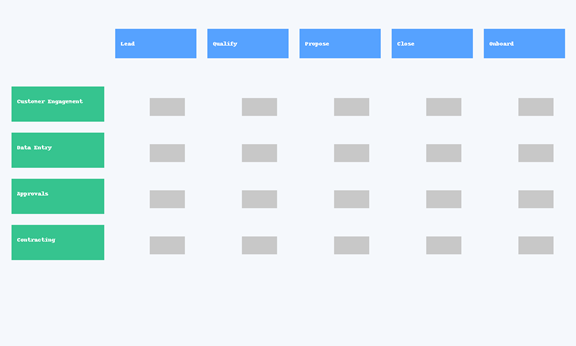
Figure 2: Enhanced sales process map with stages across the top and process categories down the side.
Access resources to start your transformation today.